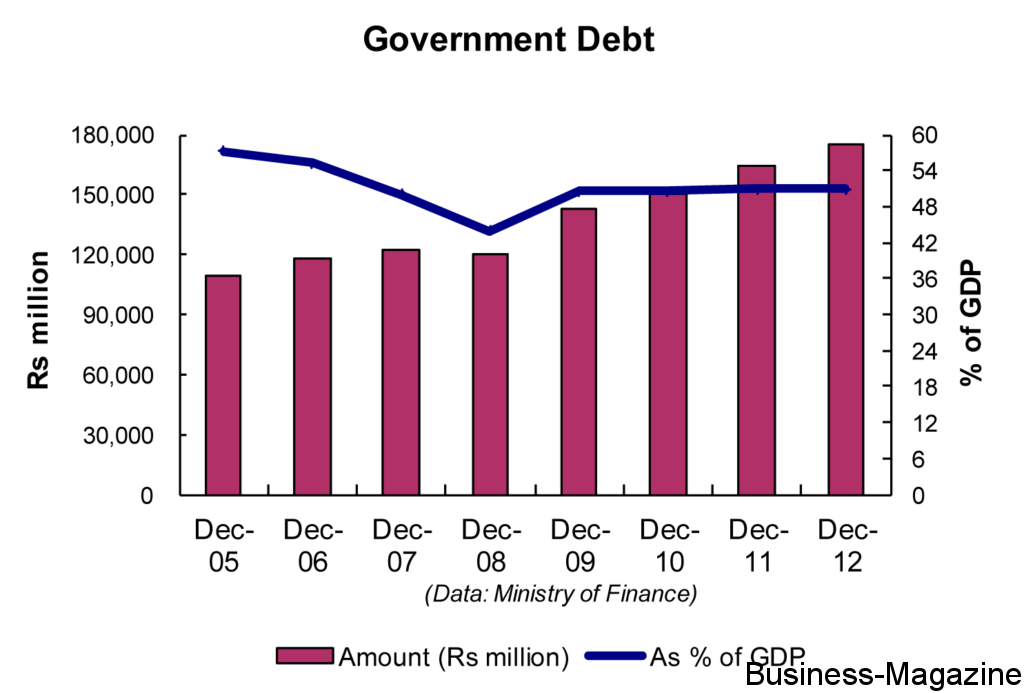
u003cp style=text-align: justify;\u003eu003cstrongu003eGovernment Debtu003c/strongu003eu003c/pu003eu003cp style=text-align: justify;\u003eGovernment debt would reach Rs 175 billion in December 2012, representing 51.0% of gross domestic product (GDP). Domestic debt would account for 80.7% of the total government debt.u003c/pu003eu003cp style=text-align: justify;\u003eu003cstrongu003ePublic Sector Debtu003c/strongu003eu003c/pu003eu003cp style=text-align: justify;\u003ePublic sector debt, as per section 6 of the Public Debt Management Act 2008, inclusive of local government debt and of public enterprise debt, would amount to Rs 196 billion in December 2012, representing 57.0% of GDP. Public enterprise debt would account for 5.9% of GDPu003c/pu003eu003cp style=text-align: justify;\u003eu003cimg alt=\ class=ImgFloatRight src=/sites/www.businessmag.mu/files/uploads/1058/tab5.png style=width: 400px;\u003eu003c/pu003eu003cp style=text-align: justify;\u003eu003cstrongu003ePublic Sector Debt ceilingu003c/strongu003eu003c/pu003eu003cp style=text-align: justify;\u003ePublic sector debt for the purpose of debt ceiling (public enterprise debt is discounted on the basis of prescribed criteria) would be Rs 186 billion in December 2012, representing 54.2% of GDP. The discounted public enterprise debt would account for 3.1% of GDP.u003c/pu003eu003cp style=text-align: justify;\u003eu003cimg alt=\ class=ImgFloatRight src=/sites/www.businessmag.mu/files/uploads/1058/tab6.png style=width: 400px;\u003eu003c/pu003e
This week, Business Magazine analyses the following three charts pertaining to Government Debt, Public Sector Debt and Public Sector Debt ceiling.